Companies such as Texas Instruments are important. This is where a lot of electrical and computer engineering graduates, like me, anchor their careers — from internships, to starting out as new grads, to finding lasting stable work in mid and late career. It is steady, unsexy, but extremely important work from a broad societal standpoint. It isn't compute or memory. It's the unglamorous silicon threaded through everything else from your kids' toys and kitchen appliances to your smartphone, to the foundational power chips running our data centers. With 80,000+ products, TI sells one of the largest catalogs in the industry, and almost everyone downstream depends on it.
The same logic applies to owning the stock. Not every position in a portfolio needs to be a 10x moonshot. You also need the measured, predictable compounders. Companies run with discipline, where capital allocation is deliberate, the dividend is dependable, and even the tax line is managed as carefully as the product roadmap. TI is one of those companies.
This article is a first principles look at the analog giant. We’ll analyze TI through three lenses.
Product — what TI makes and where it makes it, the shift to 300mm wafers, and the significance of the new Sherman, Texas fab.
Financials — decoding the recently announced Q2 earnings, benefitting from the CHIPS Act, and the free cash flow behind that 271% headline.
Strategy — where the company is steering, the 800V data center transition, and the Silicon Labs acquisition.
I’ll close with where I see the headwinds and tailwinds are from here.
Product: What does TI make, where do they make it, 300mm wafer, Sherman fab
What
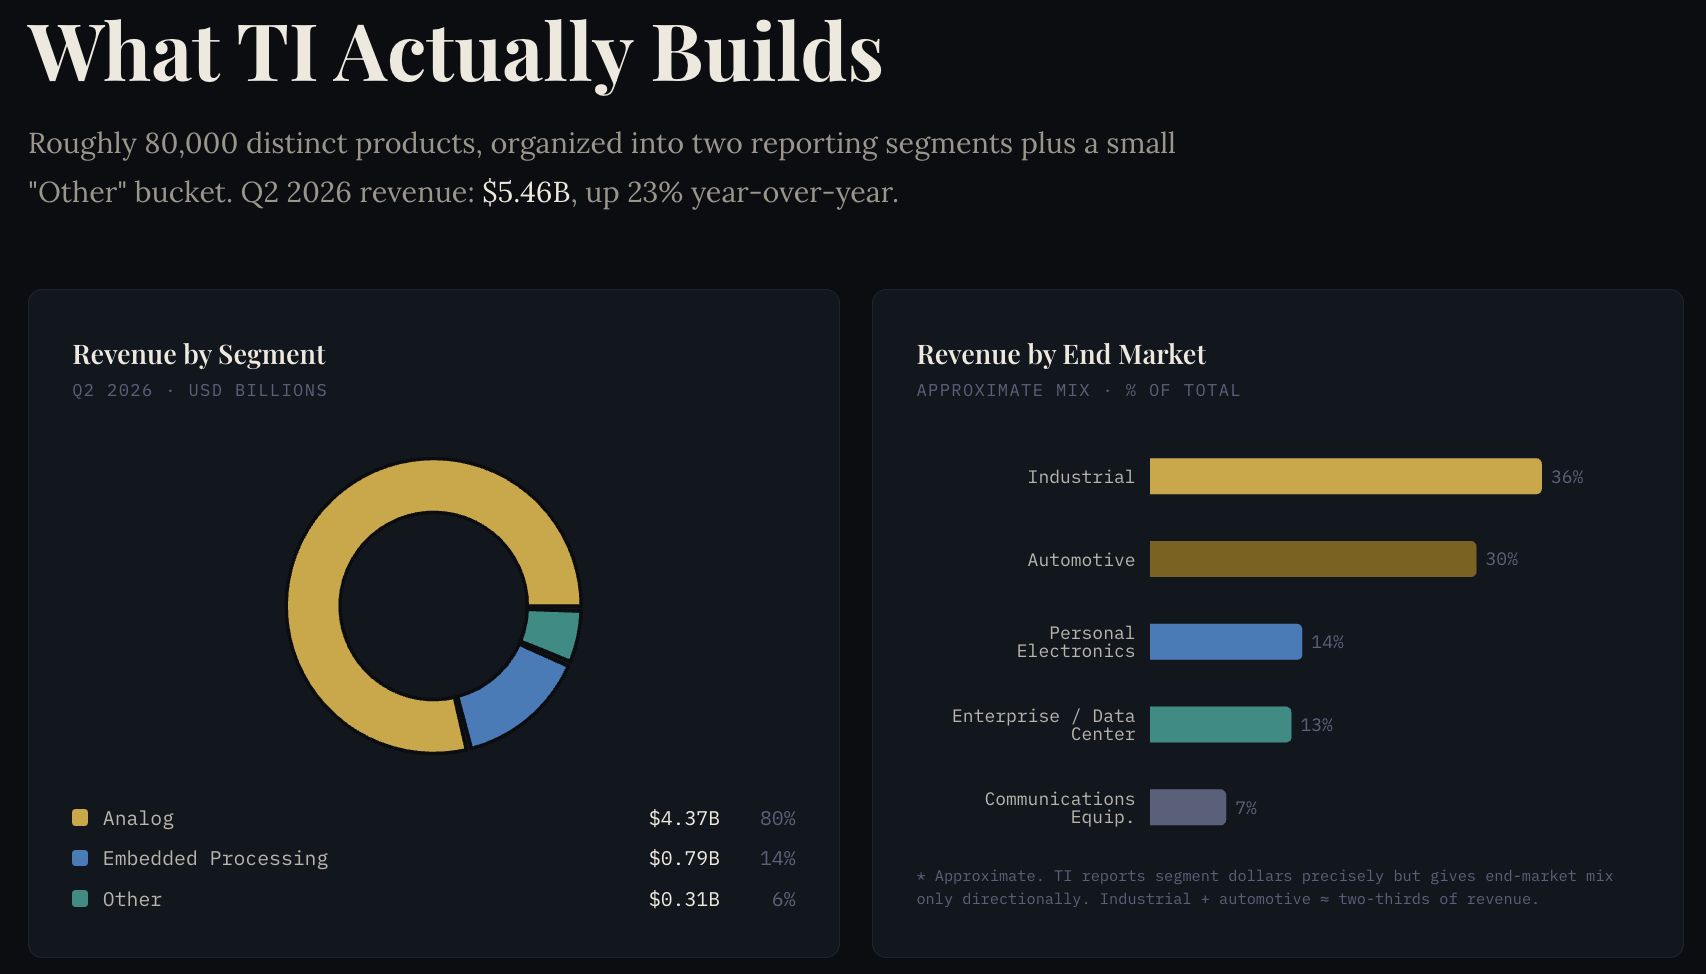
TI broadly categorizes its products into three segments: Analog, Embedded Processing, and Other. The charts below show how each segment contributes to revenue and from an end-market/application perspective who's actually buying the chips, for its most recent quarter (Q2 2026).
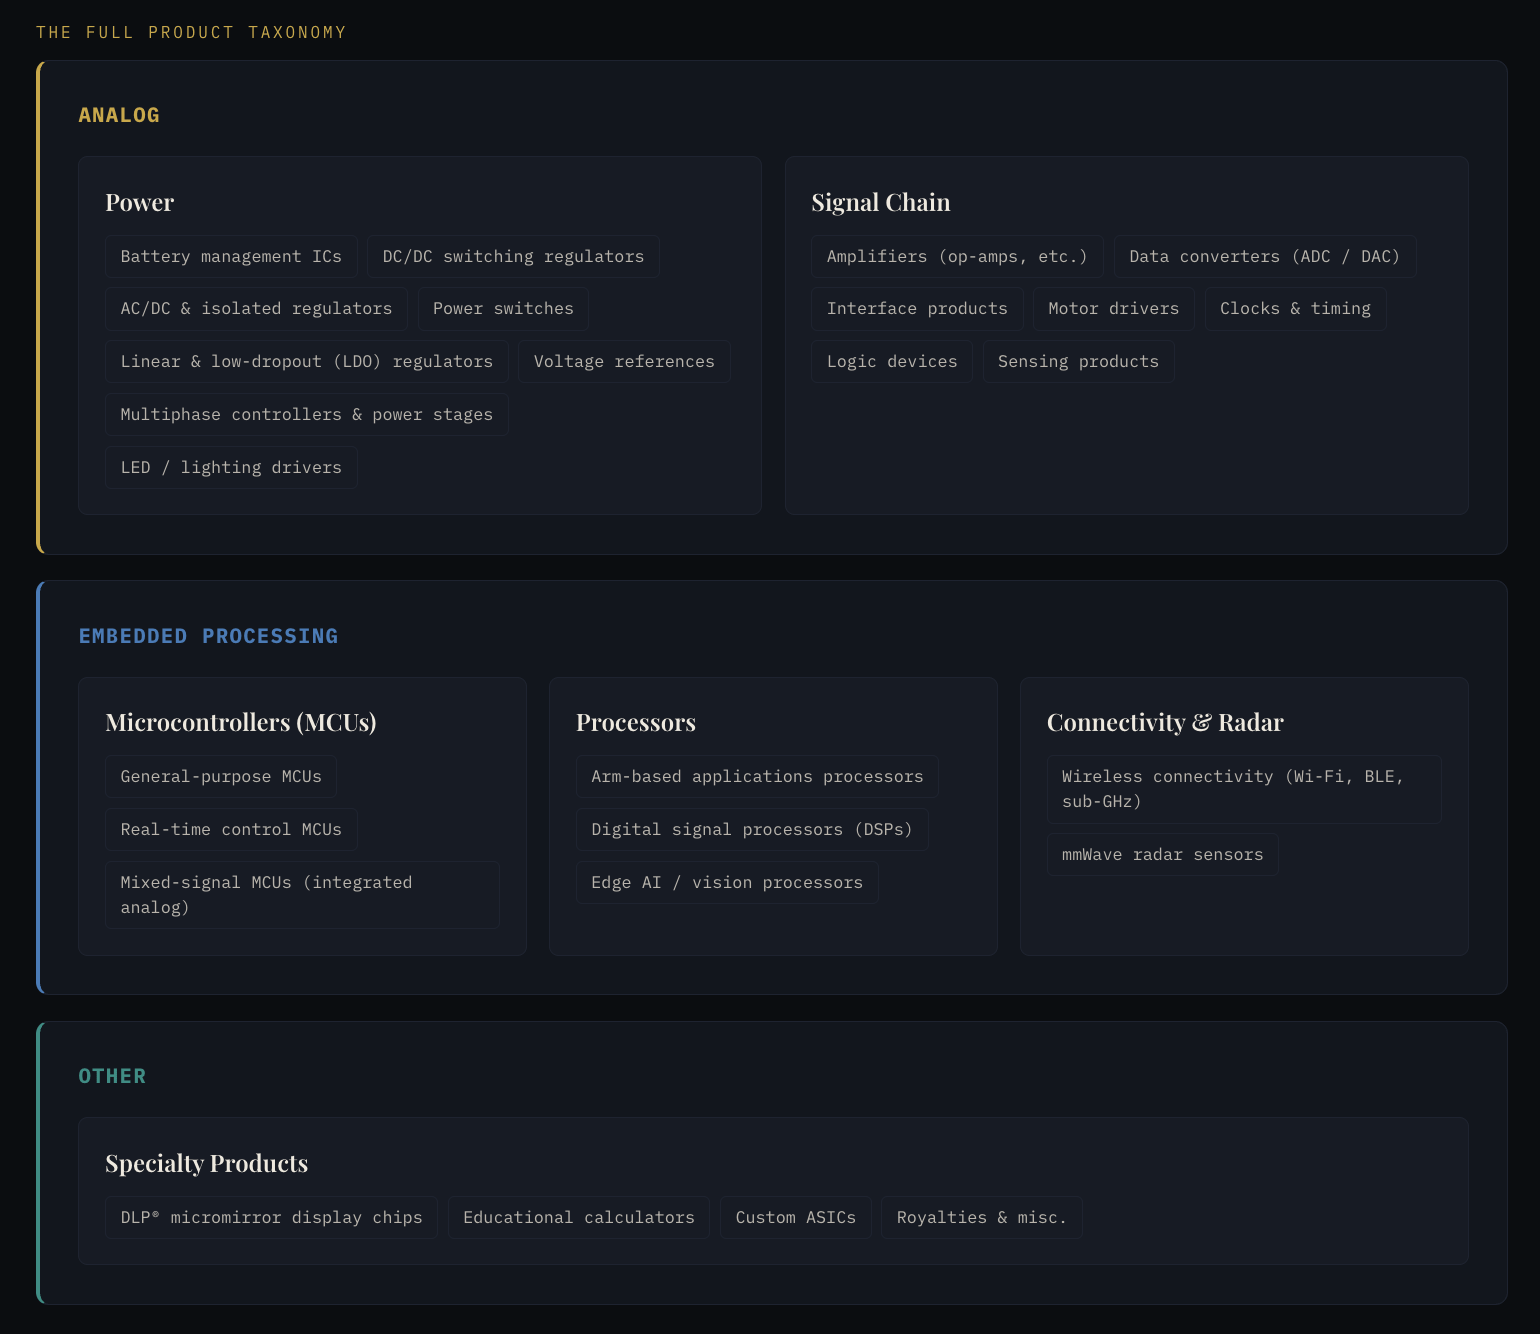
The next chart breaks down the kinds of devices TI builds under each of those three categories. All of it adds up to a catalog of 80,000+ products.
Where
TI is, what they call, an IDM (Integrated Device Manufacturer). They own and operate their own factories, unlike fabless companies like NVIDIA and AMD, which design their chips and hand the actual manufacturing to a foundry such as TSMC. TI’s manufacturing is spread across the world with the wafer production concentrated in the US, while packaging and assembly/test are done primarily in Asia.
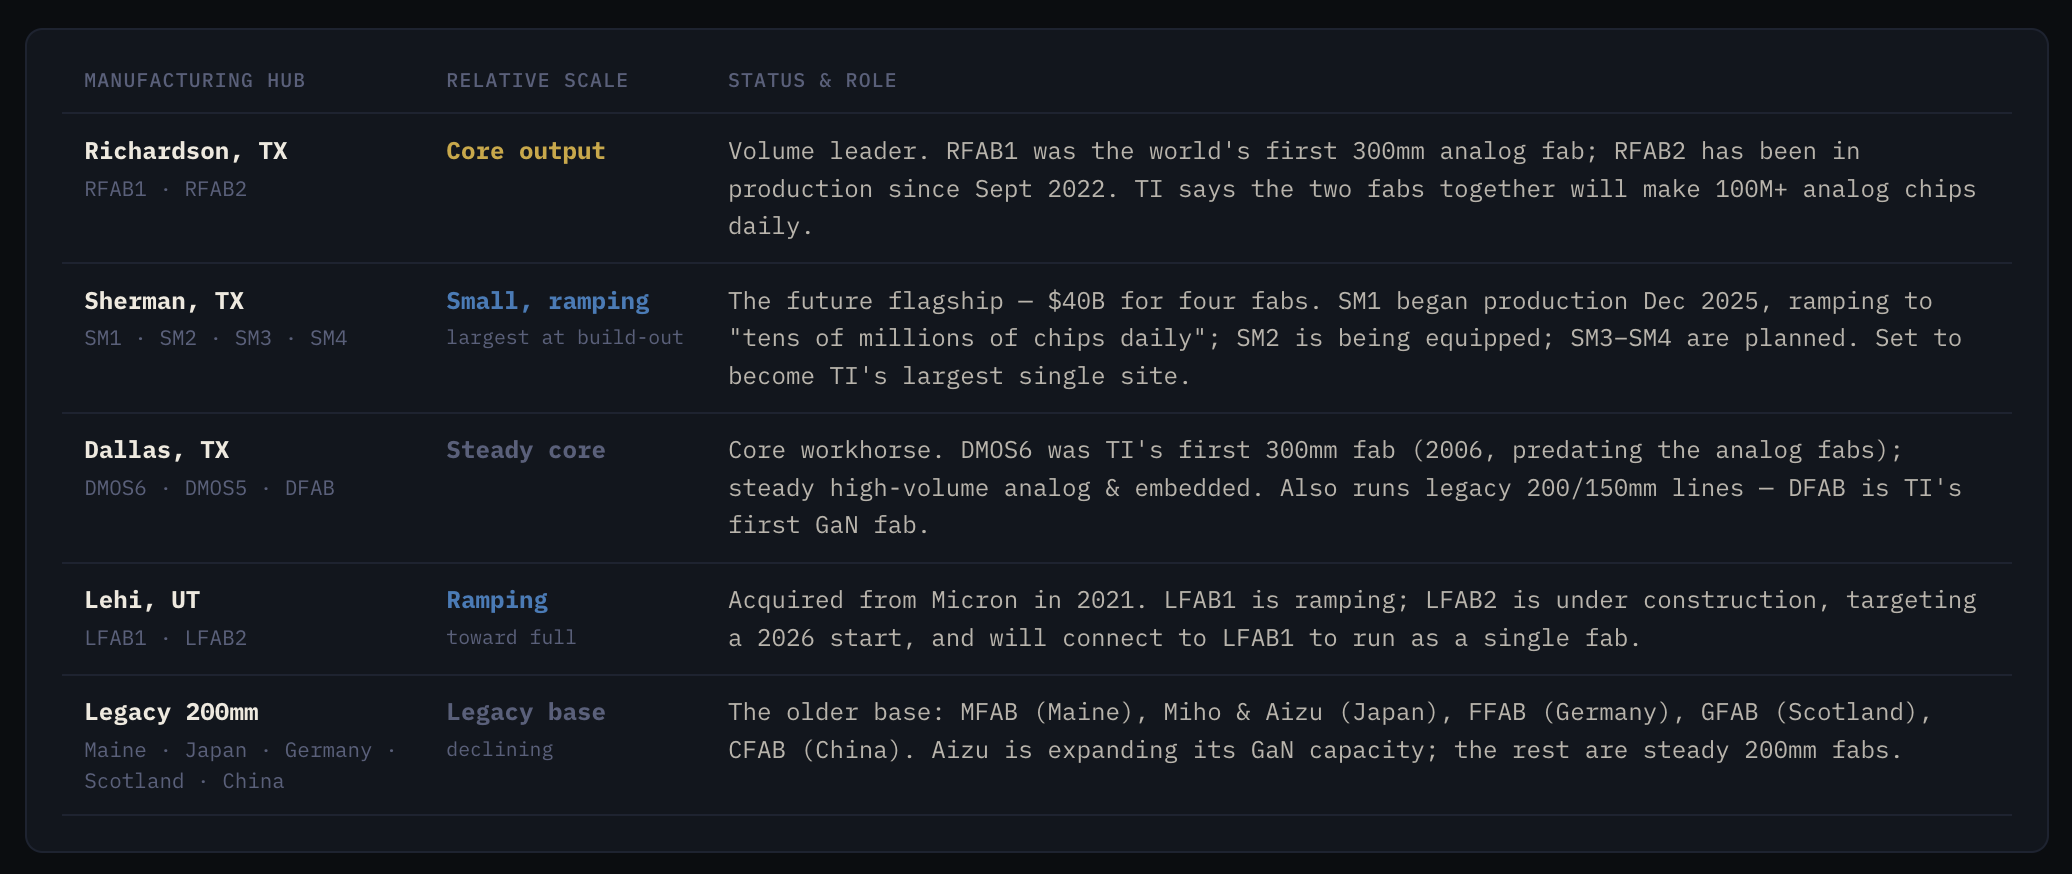
The table below shows where TI’s fabs are located and their current status. They are in the middle of a $60B+ build-out across three mega-sites (Sherman, Richardson, and Lehi), with Sherman the flagship at up to $40B. The goal of all of this is to shift the bulk of production onto modern 300mm wafers, in its own fabs, and hit a 95% in-house target by 2030 (from its current ~80%).
How
You will find a recurring mention of “300mm” across all of TI’s earnings calls. Here’s what it means.
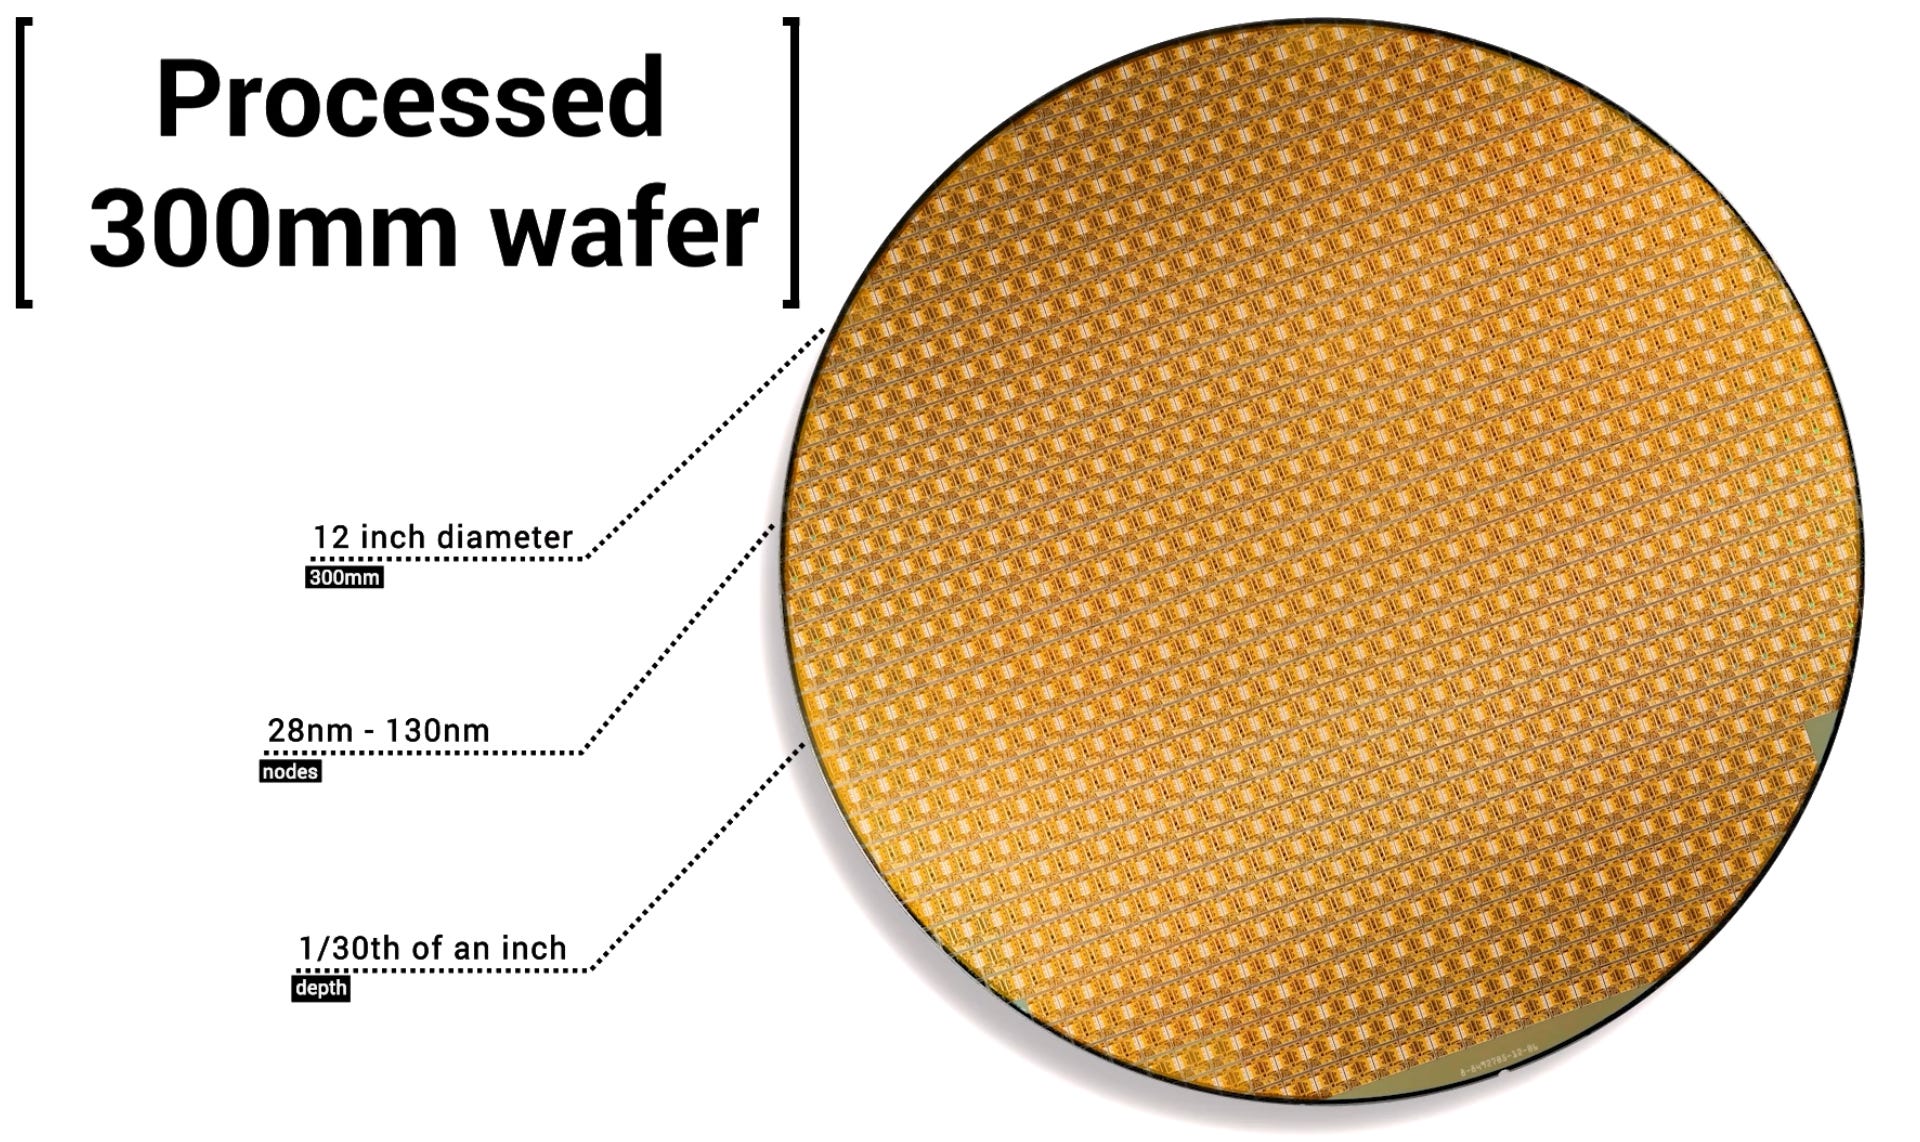
A wafer is the disc of silicon that chips are printed on before being sliced apart into individual chips. For decades the standard size was 200mm (8 inches) across. The leading edge (the wafers TSMC uses to build NVIDIA’s GPUs, or Intel for its CPUs ) moved to the larger 300mm (12 inches) more than two decades ago, because a bigger wafer yields far more chips per pass and lowers the cost of each one.
Analog, though, was slow to follow. The economics of high-mix, lower-volume analog parts long favored keeping cheap, already-depreciated 200mm lines running, so much of the analog industry still sits on 200mm today. TI broke from that and built the world’s first 300mm analog fab (RFAB1 in Richardson) in 2009, and has been moving analog production to 300mm ever since. A 300mm wafer yields roughly 2.3× more chips than a 200mm one and cuts the cost of an (unpackaged) chip by about 40%.
Financials: Q2 earnings, CHIPS Act, and 271% free cash flow jump
TI’s business, like any semiconductor company, is historically cyclical and right now it’s benefiting from the AI build-out.
To understand its financials, we’ll look at three charts:
Revenue — how much money TI makes, and the size of its operation.
Free cash flow — how much cash is left after all the spending.
Valuation — how the stock is priced, through EPS versus market cap.
For each, I’d encourage you to sit with the charts for a minute. They hold more information than I can put into words.
Revenue
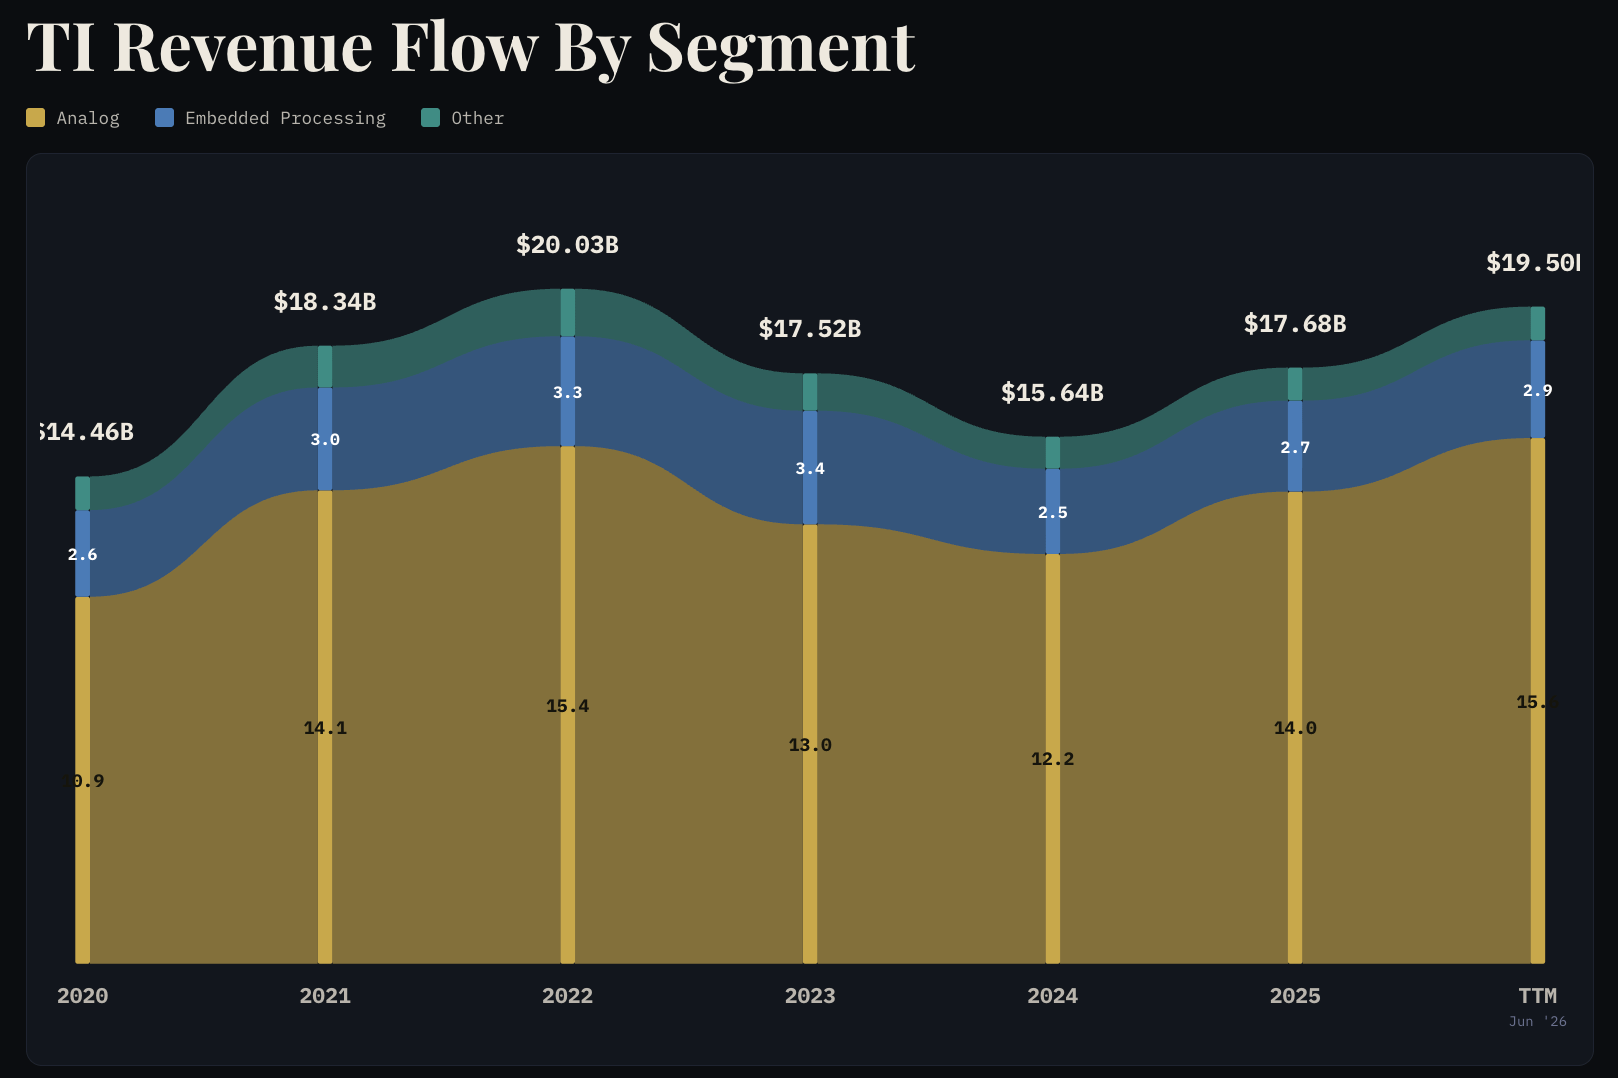
In the stacked chart below, column height is total revenue, with each column split across TI’s three categories — Analog, Embedded, and Other. TI does roughly $19.5B today. That’s the scale of the business.
2022 peak: Pandemic-era demand and pricing drove a record $20B in revenue.
2023–24 trough: An inventory correction plus industrial and auto softness pulled revenue down 22%, to $15.6B.
2025–now: A broad recovery, data center sales doubled year over year, industrial rose ~30%, and TTM revenue is nearly back to its peak.
Comparison against the field
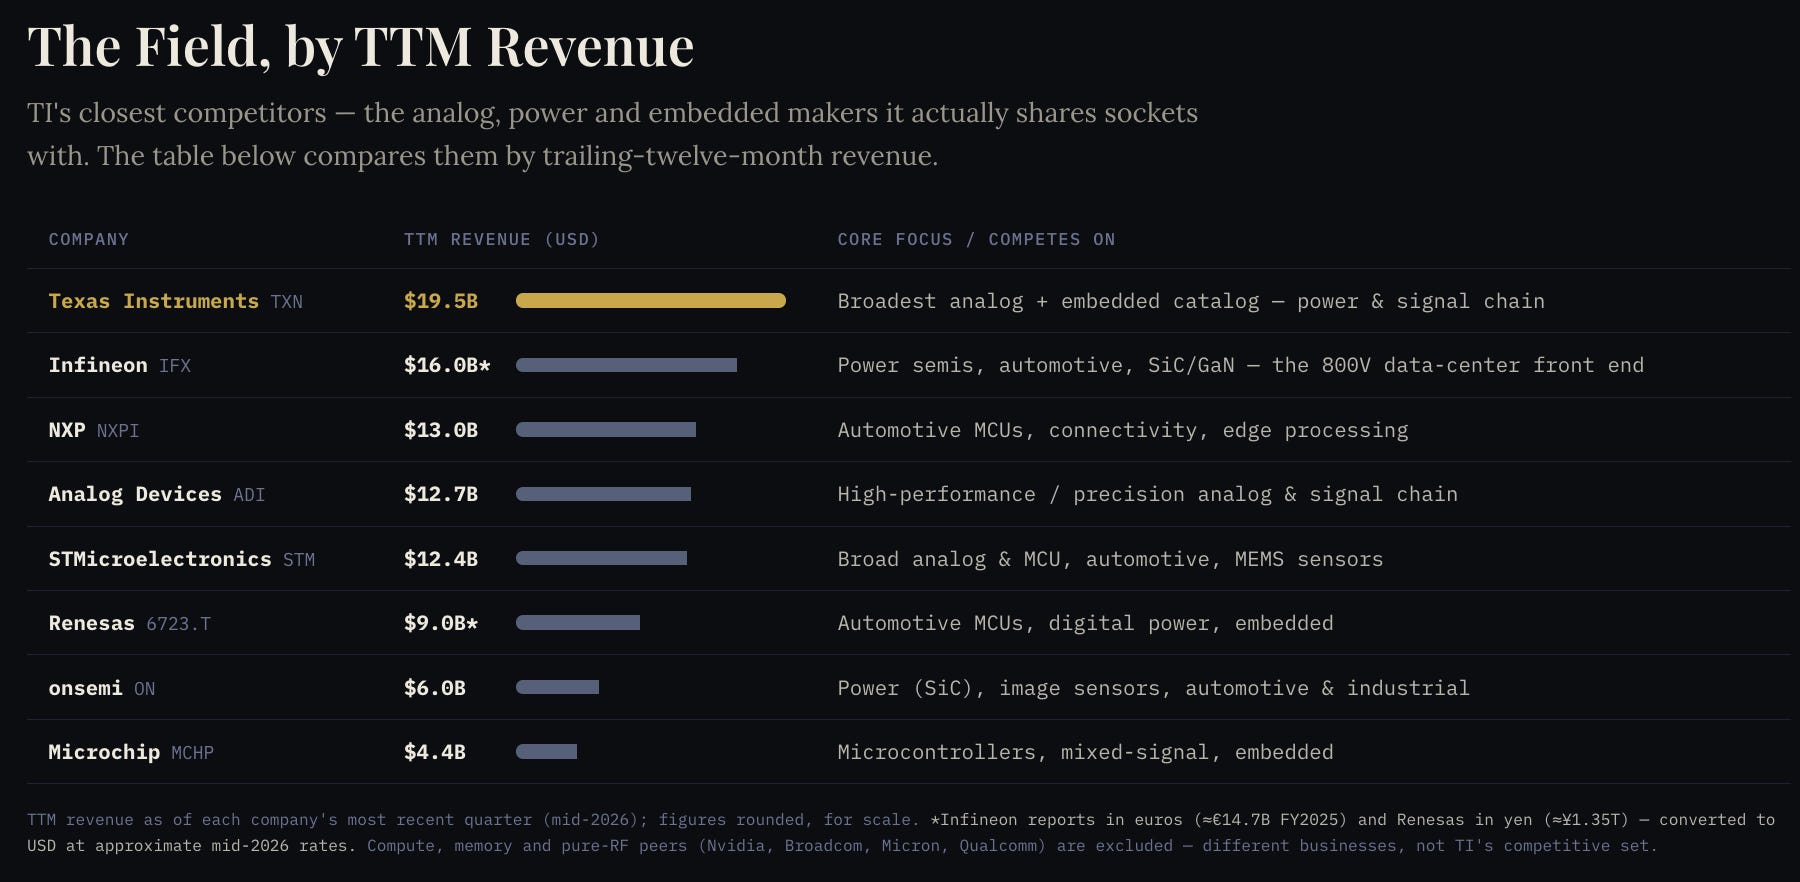
Here's how TI stacks up against the other analog, power, and embedded makers it shares sockets with, measured by trailing-twelve-month (TTM) revenue.
Free Cash Flow (FCF)
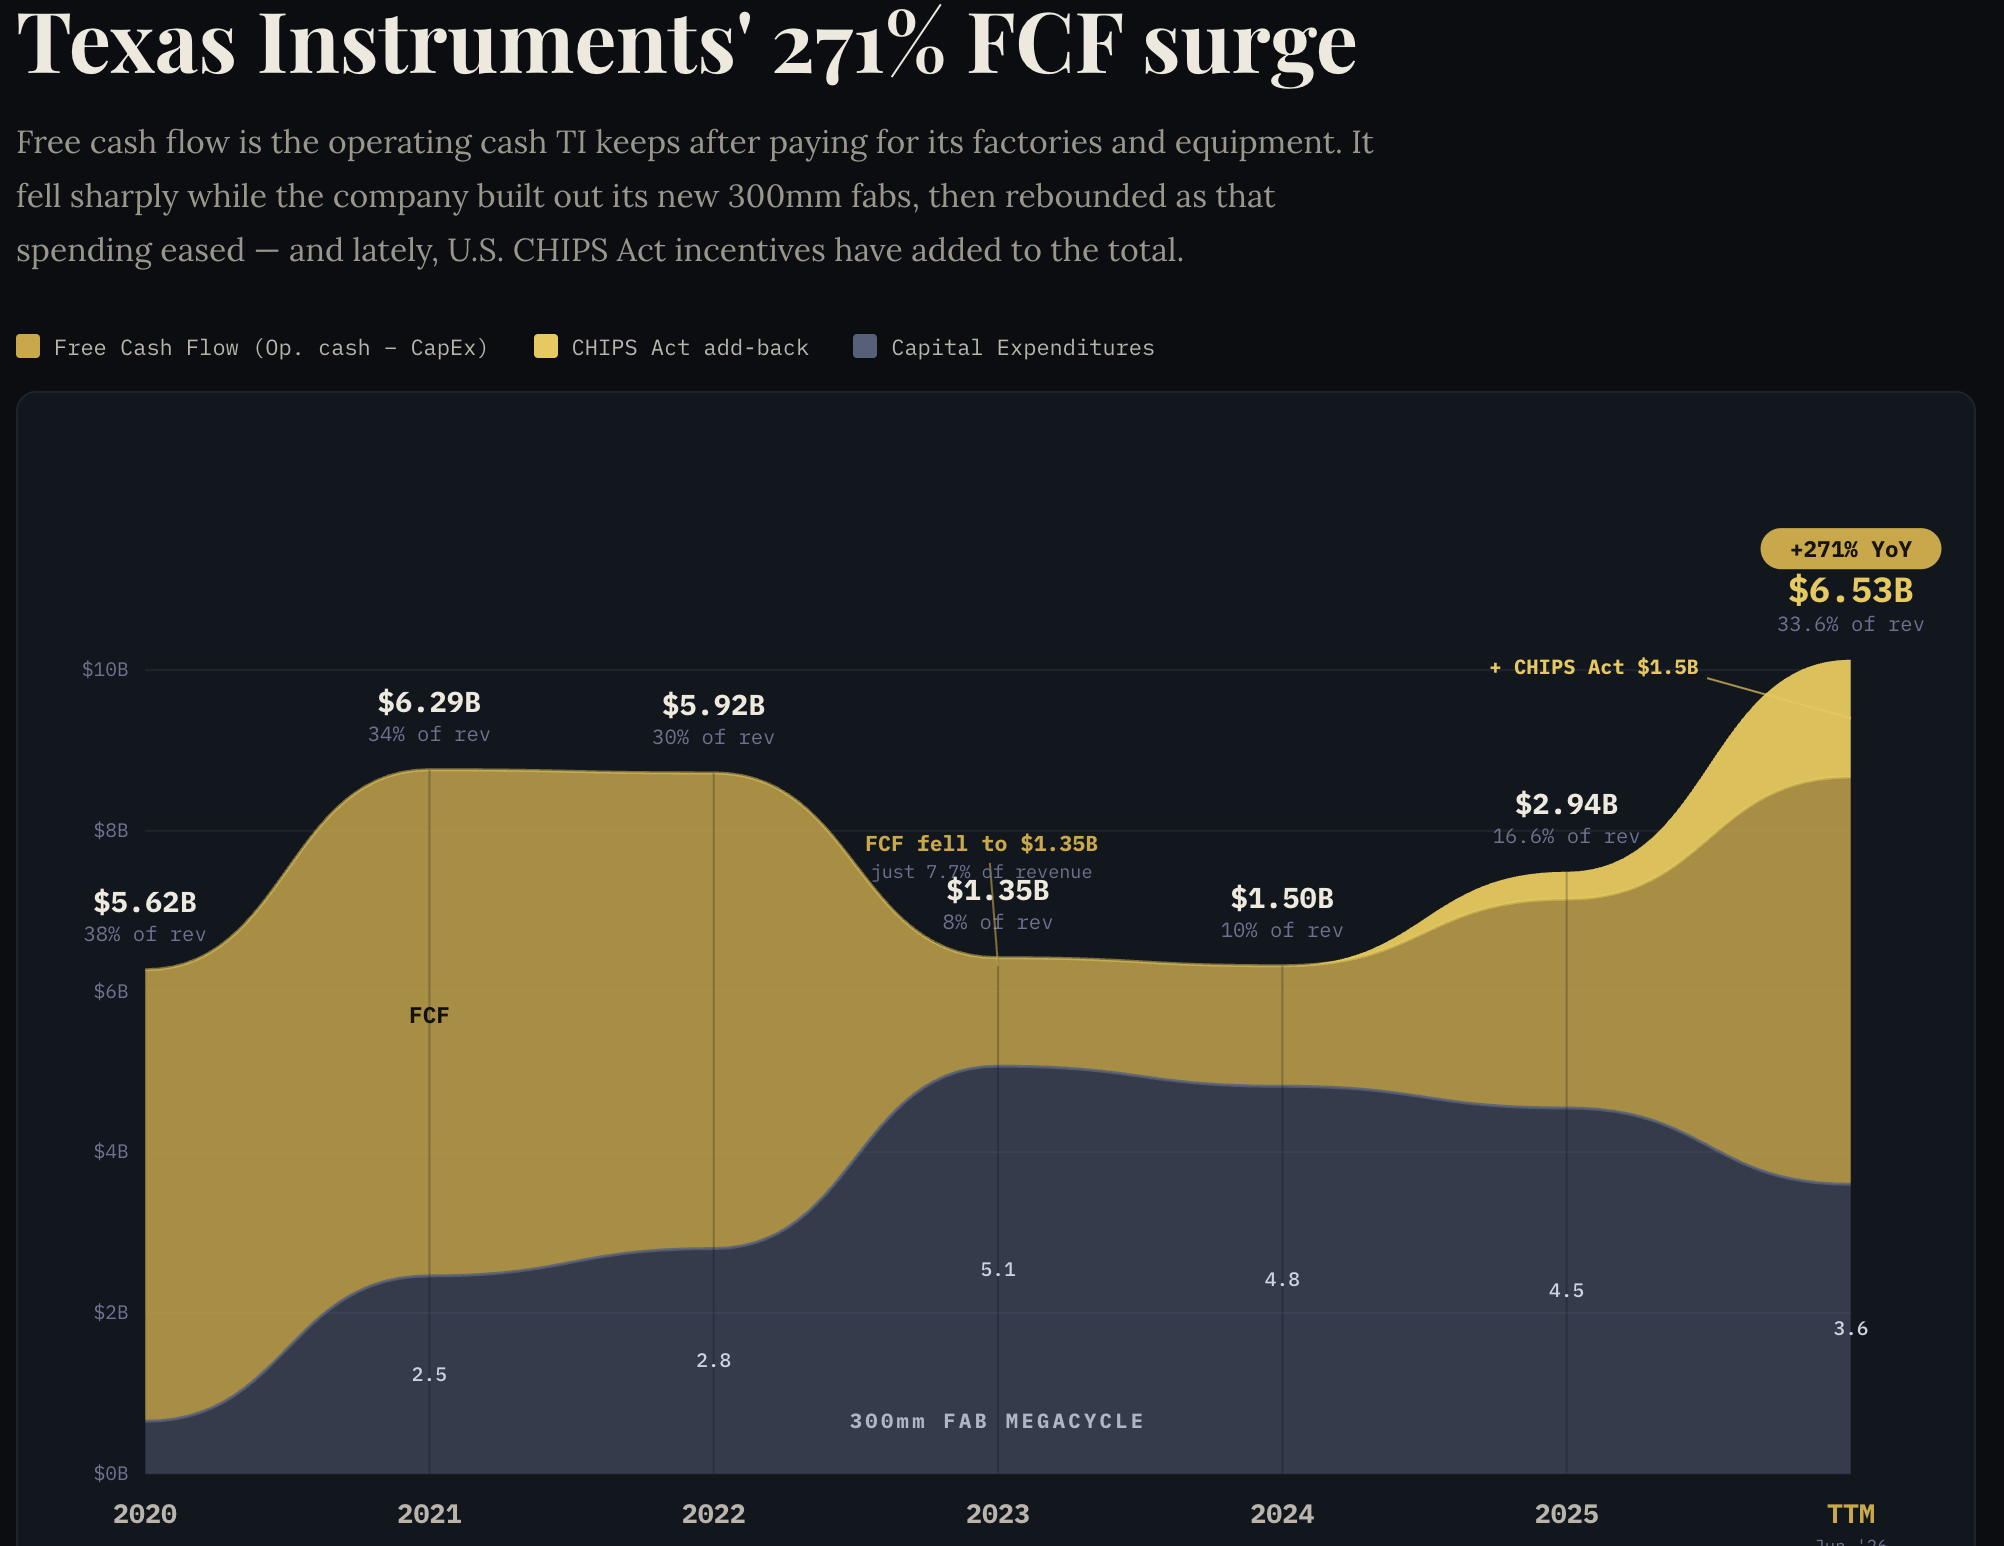
With hyperscalers spending aggressively on AI, and the chipmakers themselves expanding and building new factories, I like to see how much a company is spending relative to what it earns, and how much is left over. It’s a good read on how disciplined the capital allocation is, and how much room the company has for other strategic bets, like acquisitions.
Also, TI’s reported free cash flow includes cash from the U.S. CHIPS Act, the federal program subsidizing domestic chip manufacturing to bring production back onshore. Of the ~$6.5B in trailing free cash flow, roughly $1.5B is CHIPS Act money rather than cash from operations. This is a direct reward for the fabs TI is building on U.S. soil.
How I arrived at the 271% number
TTM FCF ending June 2026:
~$6.53BTTM FCF a year earlier (ending June 2025):
~$1.76BIncrease in FCF:
6.53 ÷ 1.76 − 1 = 2.71, i.e. +271%
Growth by segment
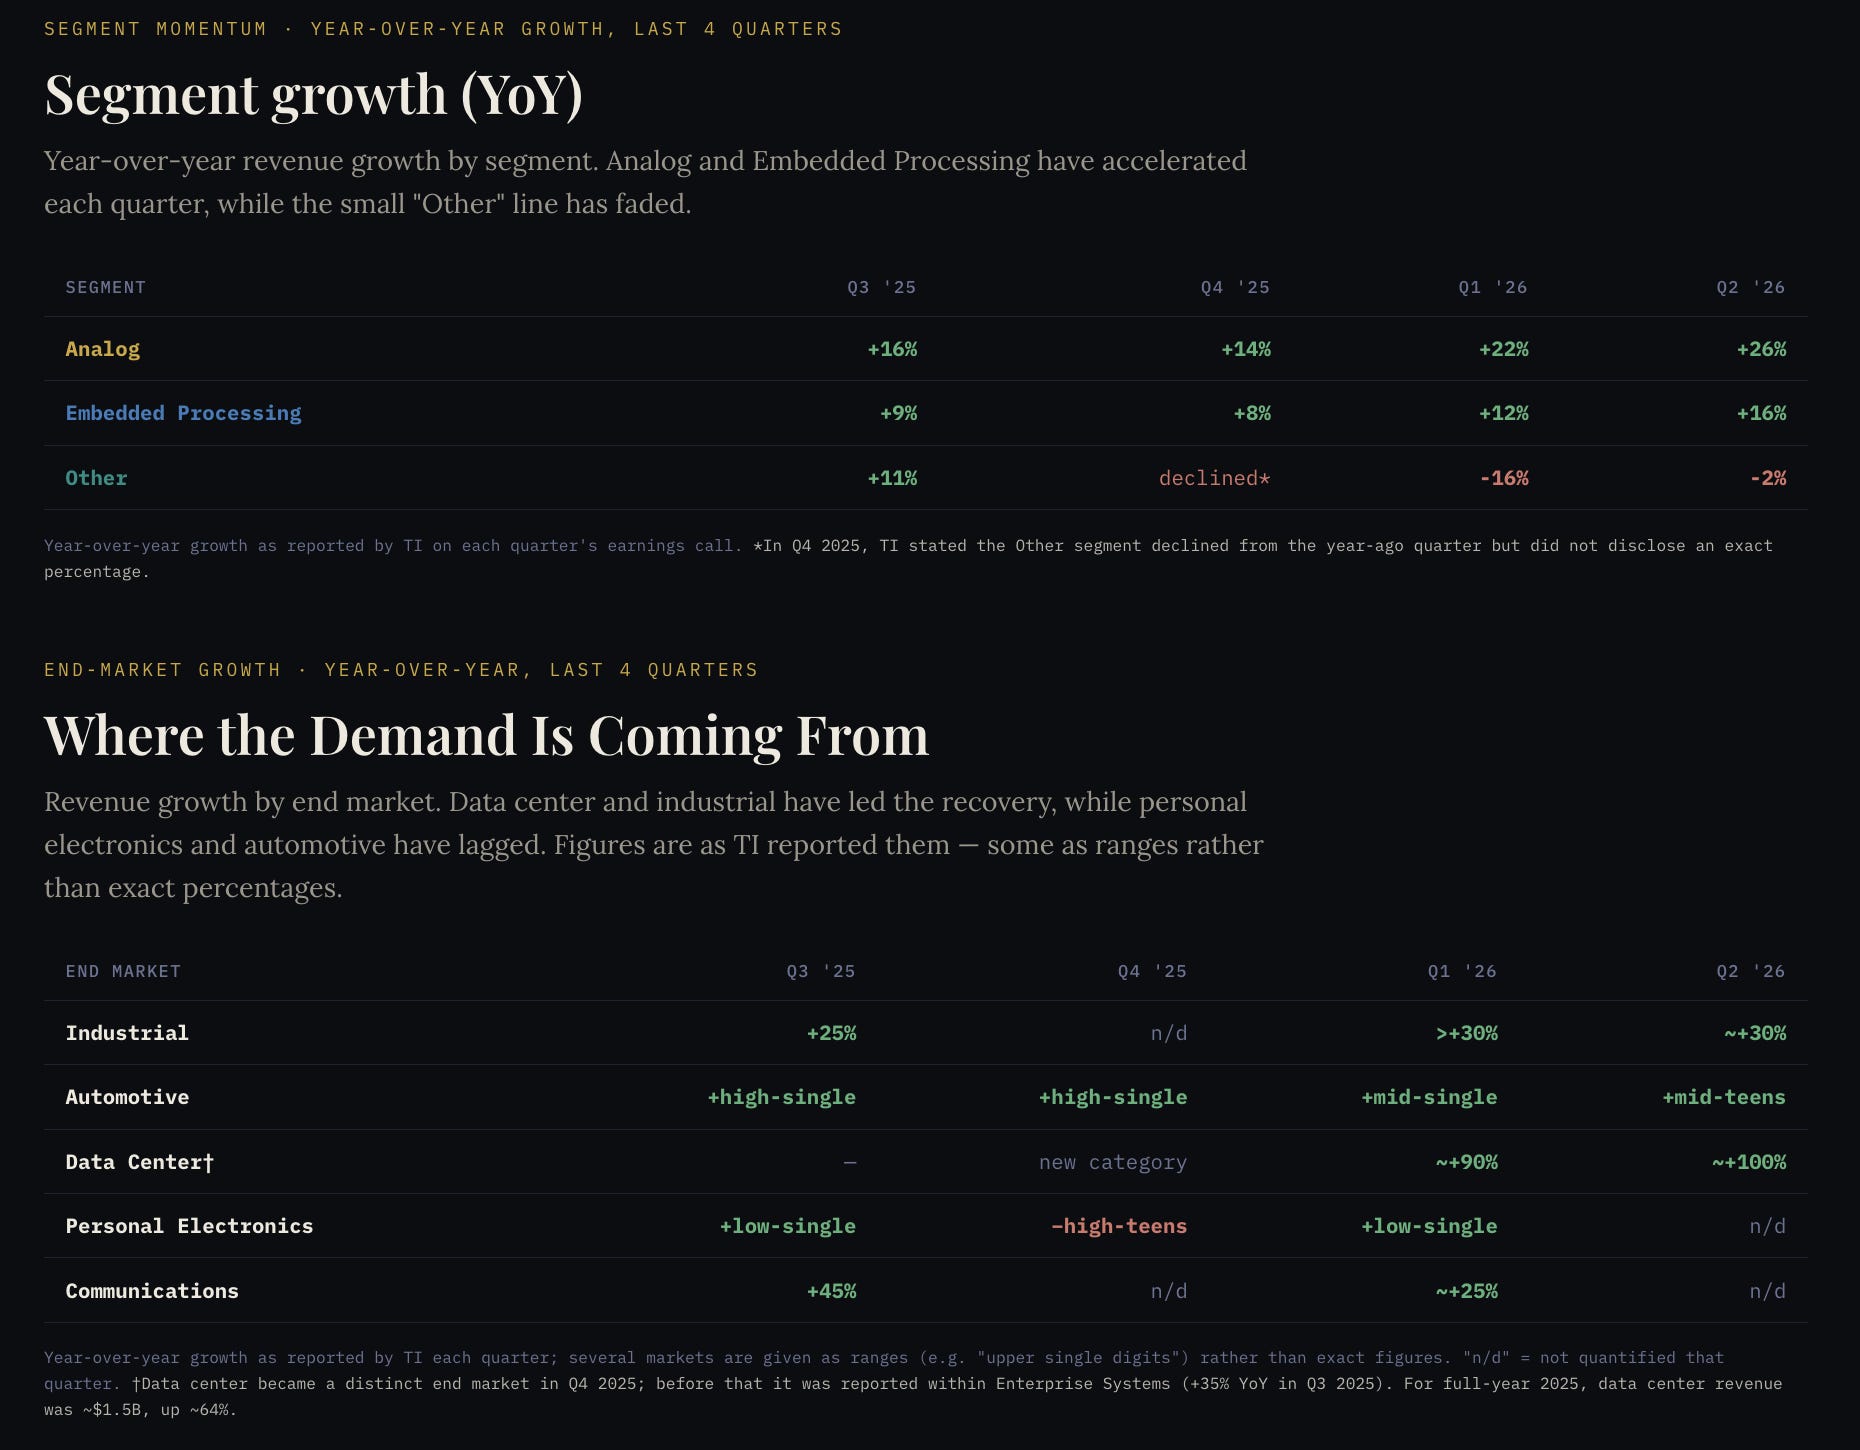
In Q4 of last year, TI began reporting data center as its own end market. It's where the company is seeing the fastest growth, for the obvious reason, with data center revenue roughly doubling year over year in the most recent quarter. The other bright spot is automotive, helped by demand from China's EV and hybrid market. On the latest call, management pointed to a broad recovery in industrial up ~30% and growing across every region, while flagging the softer corners. Personal electronics remains weak, and automotive, though recovering, is still sitting near prior-peak levels rather than breaking out.
Current valuation vs historic average
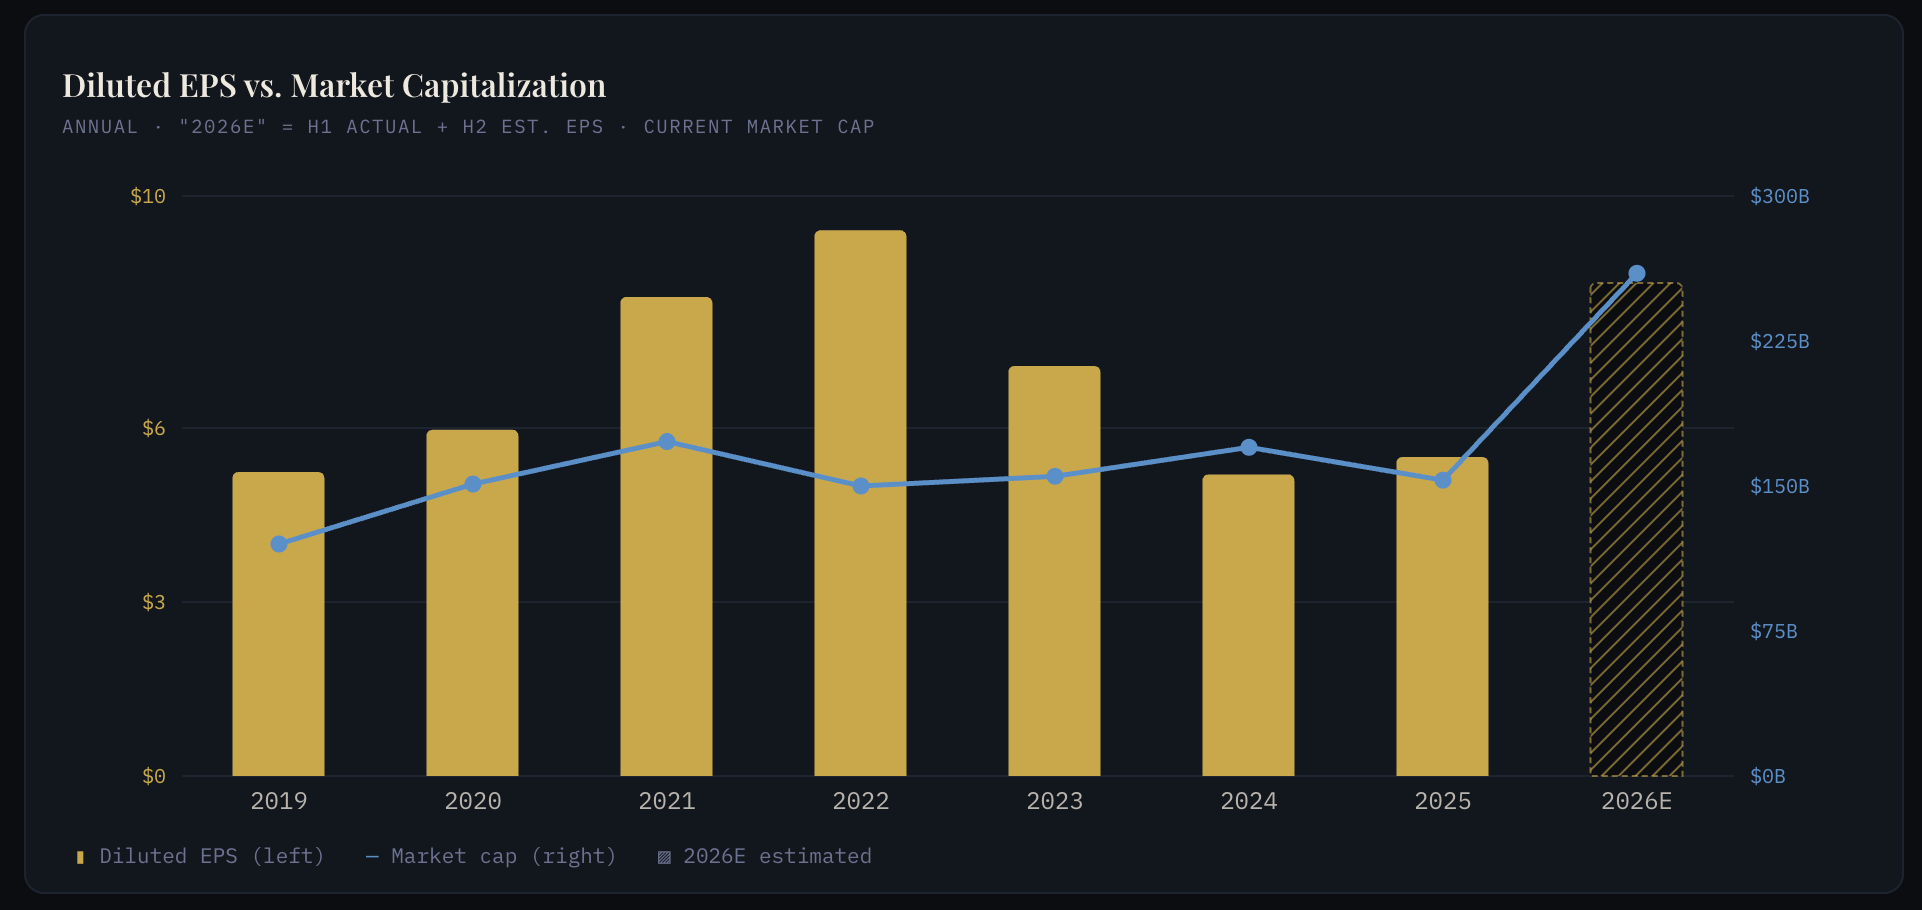
The chart below shows how TI's market cap (its stock price) relates to earnings per share (EPS). The 2026 EPS combines actual earnings from Q1 and Q2 with estimates for the second half. As it stands, the market has already priced in that projected 2026 EPS, and the stock sits at a forward P/E of about 33x, which is higher than its 10-year median of around 24x.
I think this optimism is understandable, given the growth in the industrial and data center markets, the Silicon Labs acquisition (expected to close in 2027) which will add to EPS, and the generally higher multiples semiconductor stocks are commanding right now.